Discover insights hidden in your data with Power BI
Power BI is a self-service analytics and reporting platform from Microsoft that helps organizations collate, manage, and analyze data from multiple sources, through a user-friendly interface. It is a collection of interrelated tools and services that form a complete business intelligence ecosystem and is a lifesaver for users struggling with reporting on data from legacy systems.
Power BI connects multiple data sources from excel spreadsheets to complex databases, both cloud-based and on-premises. Power BI pulls this data together and processes it, turning it into coherent, visually immersive, interactive reports and customizable dashboards that can be used to share and collaborate – even on mobile. There are many BI tools to choose from, but Power BI should be at the top of your list for 2022. Why?
-
- Power BI is the industry leader
- The platform is easy to use
- It democratizes data insights
- You can find answers fast with its industry-leading AI
- It offers unparalleled Excel interoperation
- You can stream analytics in real-time
Examples of what Power BI can do for you
(See real client use cases at the end of this section)
Power BI allows you to easily aggregate data from disparate sources and construct personalized dashboards for users. It’s a way to finally connect all those spreadsheets and databases from around your company and provide users with access to real-time, accurate data.
It allows business users with experience in Excel to take full advantage of Power BI’s intuitive data analysis capabilities to rapidly discover new insights or to visualize a challenge confronting the business.
Power BI is fantastic for financial projections and delivers new capabilities to the finance team. With powerful analysis tools like “what-if parameters,” users can easily create interactive data projections with any number of assumptions.
Insurance and reinsurance companies can reap huge rewards with Power BI when it comes to underwriting and actuarial analysis. Users can manipulate all available data sources to determine more accurate rates, assess if a risk is acceptable, or do a predictive analytics deep dive on claims.
Six things you should know about Power BI
Make no mistake, Power BI has a very long list of impressive capabilities. A quick Internet search will provide you with ample reasons for you to consider using the tool as well as details on its most important functionality, such as its robust self-service capabilities. If you already have the tool in place, most companies get formal training so their teams can maximize its value and hit the ground running. In the meantime, here are six highlights for you to consider…
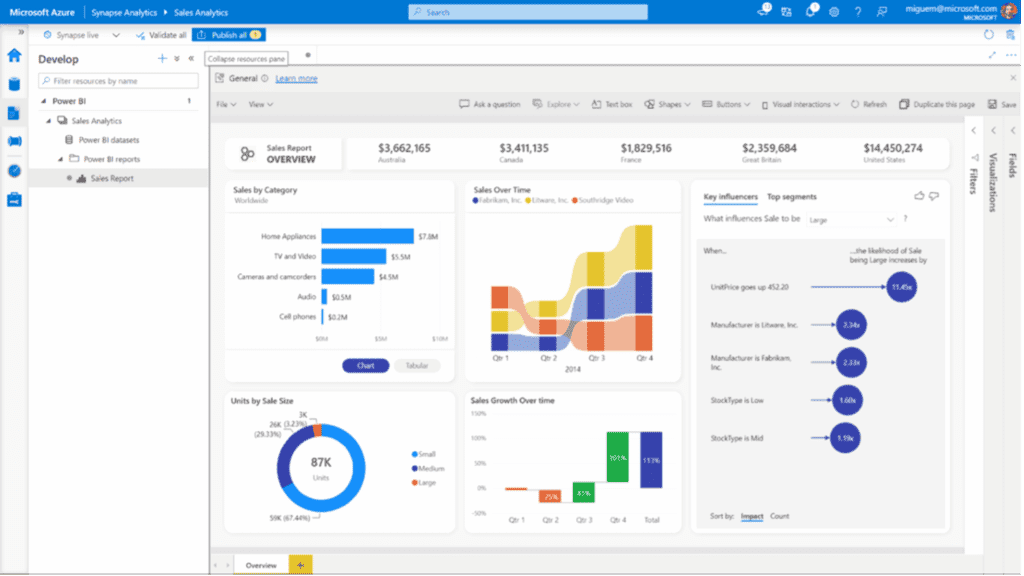
Snapshot of Power Bi dashboard. Image from Microsoft’s Why Power BI – Features & Benefits | Microsoft Power BI
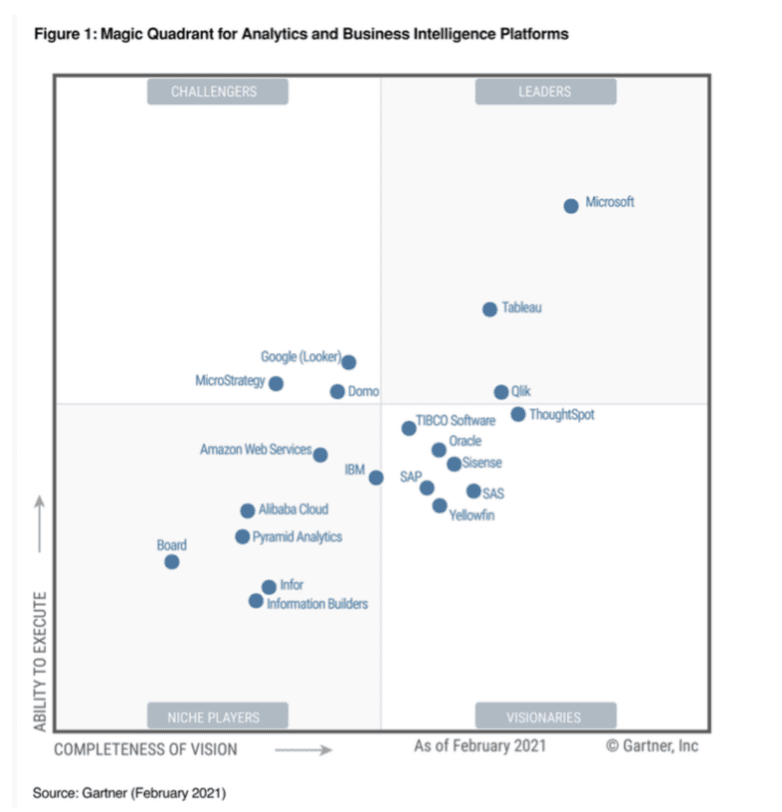
Industry Leader: Microsoft Power BI is one of the top BI platforms and Gartner has recognized it as a Magic Quadrant Leader for 14 consecutive years. It is used to democratize data insights for more than 6 million users and is used in 97% of Fortune 500 companies. There is a massive community of users that share tips, techniques, and answers to tough questions.
Power BI is easy to use: Power BI has a simple and user-friendly interface that allows non-technical users to build data visualizations quickly and answer complex data questions without the need for programming skills. Businesses can create a data-centric culture and empower their employees to use analytics every day in their reporting, planning and decision-making processes. Power BI is very intuitive to Microsoft users, especially those familiar with Excel.
Democratize data insights: Power BI helps enterprises democratize data by providing an integrated system where users view and access visual data in a matter of minutes. Users can customize, analyze and visualize data with easy-to-use data governance tools and innovative functionality to yield insights in a way that positively impacts the business.
Power BI transforms unstructured data into visually pleasing charts, reports, and dashboards that are easy to understand for the end-users. To further support data democratization, self-service Power BI capabilities also include centralized data models so users access real-time data.
Find answers fast with industry-leading AI: Power BI helps non-data scientists prepare data, build machine learning models, and find insights quickly from both structured and unstructured data. Power BI combines natural language search interfaces to enable users to create visualizations and uncover insights using search terms in plain English, without requiring code or syntax. Voice recognition is also supported with Power BI, allowing you to ask for information on the go.
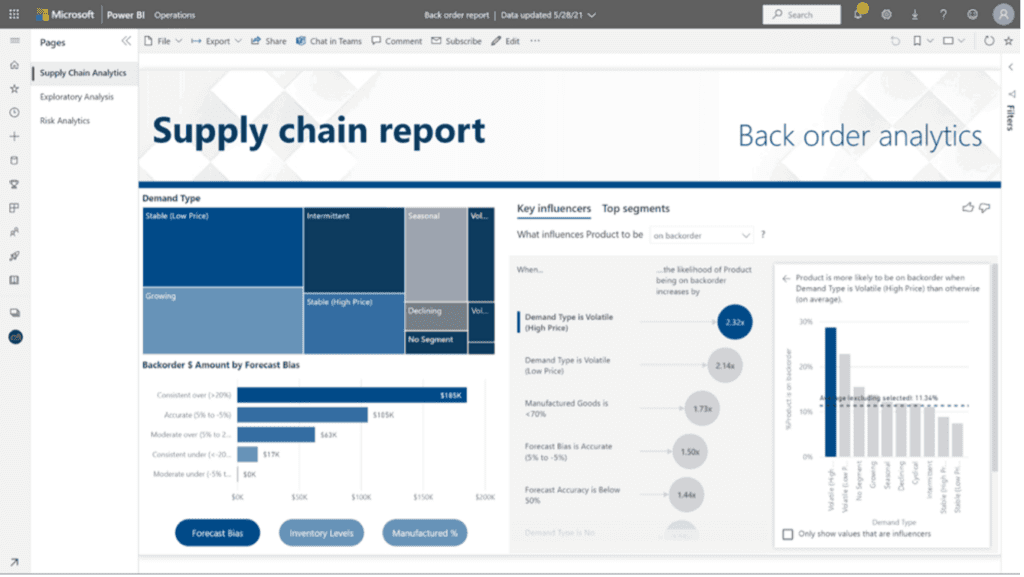
Image from Microsoft’s Why Power BI – Features & Benefits | Microsoft Power BI
Get unparalleled Excel interoperation: You can easily connect Excel queries, data models, and reports to Power BI Dashboard. In just a few simple steps, you can quickly gather, analyze, publish, and share Excel business data.
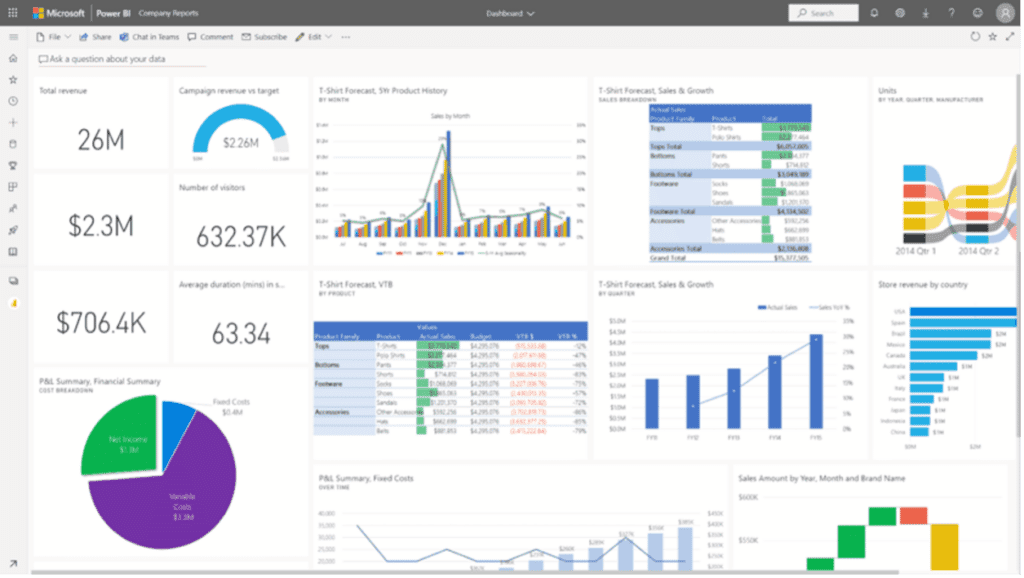
Image from Microsoft’s Why Power BI – Features & Benefits | Microsoft Power BI
Stream analytics in real-time: Users have access to real-time analytics so you are always ready to make timely decisions. If you need to make forecasts for your business, you can use Power BI machine learning to make it happen. Your decision will be informed by the latest, most accurate data about your organization. These actionable insights can be shared across your organization so everyone is aware of the current situation.
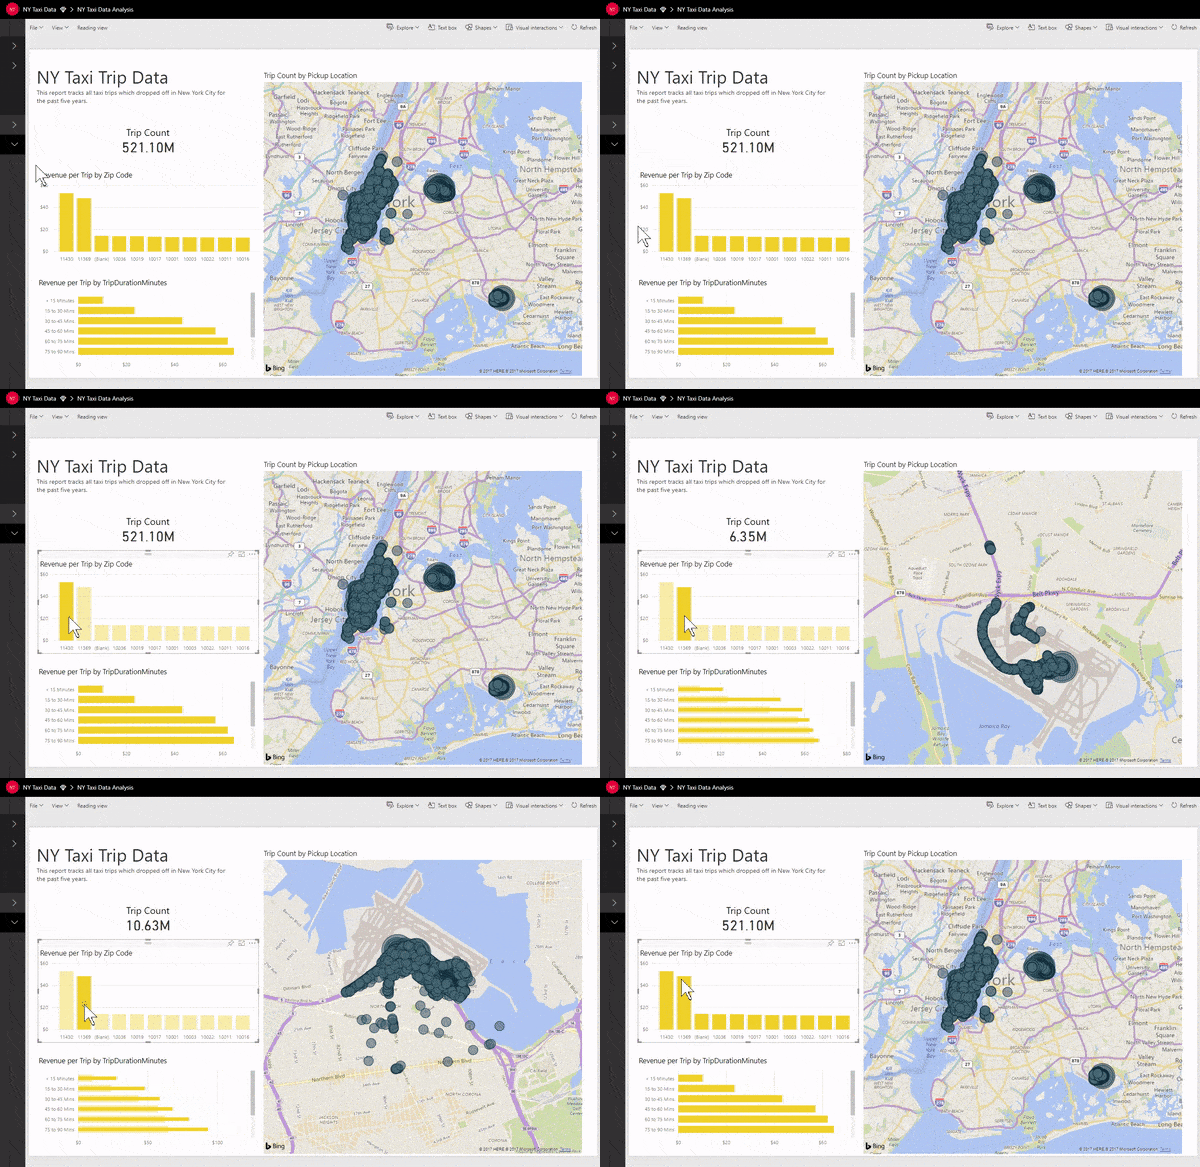
Power BI reports are interactive, allowing users to click on elements to filter and drill down. Image from Microsoft’s Power BI Blog.
Power BI use cases to consider
Microsoft’s Power Platform is incredibly flexible and can help solve a wide variety of challenges your company may be facing. As one of the three pillars of the platform, Power BI can be used to transform how you access and analyze data from across the company. It puts powerful decision-making tools in the hands of all types of users, including non-technical, expert business professionals.
CCS’s Microsoft-certified team develops real-time dashboards and interactive reporting interfaces for companies looking to improve their ability to capture, clean, transform and analyze disparate data sources, most importantly Excel. Here are some Power BI use cases which demonstrate just how powerful the tool can be…
Resource and project management
The first example is from a reinsurance client with employees distributed in different countries performing a variety of different business processes. As the company expanded, they were facing some problems:
-
- Significant inefficiencies in managing resources
- Lack of control on projects
- Inability to produce accurate/timely information for all reporting requirements
The client’s data was stored in multiple data sources with no clear visibility or transparency. To solve this problem, we connected Microsoft Project and Excel with Power BI to aggregate all the information related to the projects and resources. We used Power Query to clean, organize and extract the data from Excel and the Project Power BI template to produce reports.
Power BI not only solved the problems but provided the company with new data that helped the company have more visibility on its day-to-day business processes. After the solution was implemented, the customer was able to:
-
- Allocate resources efficiently
- Control budgets more effectively
- Access and produce accurate, timely information
- Audit and track all projects around the globe
- Improve overall efficiency and control of projects
Claim handling statistics and analysis
The client was a large insurance company whose managers needed to report on claim handling workloads and trends. Using Power BI, we were able to capture and report on both structured and unstructured data, enabling the creation and tracking of meaningful KPIs for claim handling as well as producing accurate trend reports.
The company was able to develop valuable business insights based on real-time data coming from multiple, disparate data sources and easily produce these reports with a click of a mouse:
-
- Claim handling statistical reports
- Claim handling trend reports
- Claim settlement activity

0 Comments